
Get 2Lakh Prize Money
If you solve Easyalgo DSA sheet then you can get a chance to get a prize of Rs. 2 lakhs, you have to solve only 350 questions.!
March 9, 2024, 5:43 a.m.
A pie chart is a circle chart, dividing the circular statical graph into sections. It is a mathematical representation that shows skills, grades, performance, and many others. A pie chart requires a list of categorical variables and numerical variables to represent data in a simple and easy-to-understand way. This chart helps many sectors, like organizing, company data, and many other sectors, and shows data as a percentage of a whole.
<script src="https://cdn.jsdelivr.net/npm/chart.js"></script>
<script type="text/javascript" src=
    "https://cdn.jsdelivr.net/npm/chart.js/dist/chart.umd.min.js">
</script>
This HTML document is a simple example of creating a pie chart using Chart.js library. Let's break down the structure and functionality:
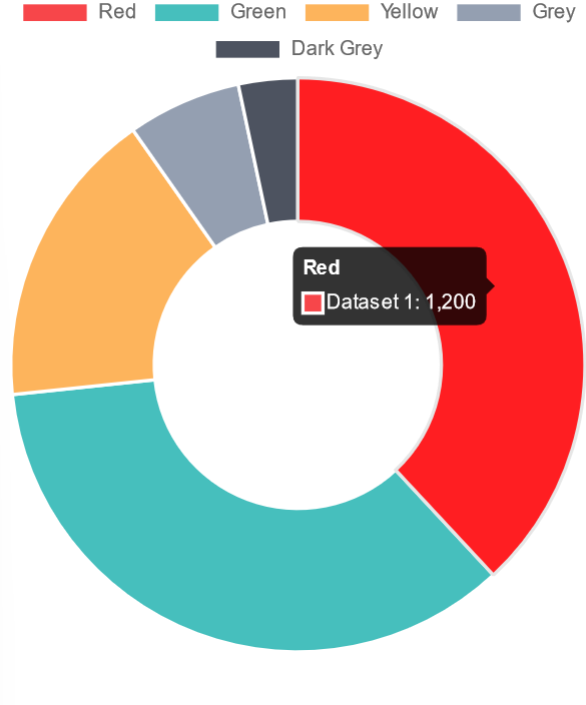
This code sets up a simple pie chart displaying lines of code for various programming languages (HTML, CSS, JavaScript, Python, and Tailwind CSS) using Chart.js library.
const options = {
            plugins: {
                datalabels: {
                    display: true,
                    color: 'white',
                    font: {
                        weight: 'bold'
                    }
                }
            }
        };
Example: The below code uses a Chart.js built-in plugin to show labels on a pie chart.
<!DOCTYPE html>
<html lang="en">

<head>
    <meta charset="UTF-8">
    <meta name="viewport" content=
"width=device-width, initial-scale=1.0">
    <title>Pie Chart</title>
    <script src=
"https://cdn.jsdelivr.net/npm/chart.js">
    </script>
    <script type="text/javascript" src=
"https://cdn.jsdelivr.net/npm/chart.js/dist/chart.umd.min.js">
    </script>

</head>

<body>

    <canvas id="myPieChart"
        style="padding-bottom: 40px;
                margin-bottom: 20px;
                width: 150px;
                height: 150px;">
    </canvas>


    <script>

        const data = {
            labels:
                ['HTML', 'CSS', 'Javascript',
                'Python', 'Tailwind CSS'],
            datasets: [{
                label: 'Lines of Code',
                data:
                    [10000, 15000, 20000,
                    25000, 30000],
                backgroundColor: [
                    'rgba(255, 99, 132, 0.5)',
                    'rgba(54, 162, 235, 0.5)',
                    'rgba(255, 206, 86, 0.5)',
                    'rgba(75, 192, 192, 0.5)',
                    'rgba(153, 102, 255, 0.5)'
                ],
                borderColor: [
                    'rgba(255, 99, 132, 1)',
                    'rgba(54, 162, 235, 1)',
                    'rgba(255, 206, 86, 1)',
                    'rgba(75, 192, 192, 1)',
                    'rgba(153, 102, 255, 1)'
                ],
                borderWidth: 1
            }]
        };
        const ctx =
            document.getElementById('myPieChart').
            getContext('2d');

        const options = {
            plugins: {
                datalabels: {
                    display: true,
                    color: 'white',
                    font: {
                        weight: 'bold'
                    }
                }
            }
        };
        const myPieChart = new Chart(ctx, {
            type: 'pie',
            data: data,
            options: options
        });
    </script>
</body>

</html>
Output:

var ctx = document.getElementById('myPieChart').getContext('2d');
var myPieChart = new Chart(ctx, {
  type: 'pie',
  data: {
    labels: ['Physics', 'Math', 'Chemistry', 'History', 'Biology'],
    datasets: [{
      data: [20, 25, 15, 10, 30],
      backgroundColor: [
        'red',
        'blue',
        'yellow',
        'green',
        'purple'
      ]
    }]
  },
  options: {
    plugins: {
      datalabels: {
        color: 'black', // Color of the labels
        font: {
          weight: 'bold' // Font weight of the labels
        },
        formatter: function(value, context) {
          return context.chart.data.labels[context.dataIndex] + ': ' + value + '%';
        }
      }
    }
  }
});
The following code shows a simple example of a pai chart with skills on the circal and show the data.
<!DOCTYPE html>
<html lang="en">
<head>
  <meta charset="UTF-8">
  <meta name="viewport" content="width=device-width, initial-scale=1.0">
  <title>Pie Chart with Data Labels</title>
  <script src="https://cdn.jsdelivr.net/npm/chart.js"></script>
  <script src="https://cdn.jsdelivr.net/npm/chartjs-plugin-datalabels"></script>
</head>
<body>
  <canvas id="myPieChart" width="400" height="400"></canvas>

  <script>

    // Data visualization supports analytical findings in English essays or presentations.
    // Pie charts with data labels make statistical information more engaging and comprehensible.

    Chart.plugins.register({
      afterDatasetsDraw: function(chart) {
        var ctx = chart.ctx;

        chart.data.datasets.forEach(function(dataset, i) {
          var meta = chart.getDatasetMeta(i);
          if (!meta.hidden) {
            meta.data.forEach(function(element, index) {
              var data = dataset.data[index];
              if (data !== 0) {
                var position = element.tooltipPosition();
                ctx.fillStyle = 'black'; // Label color
                ctx.textAlign = 'center';
                ctx.textBaseline = 'middle';
                var fontSize = 16; // Label font size
                var fontStyle = 'normal'; // Label font style
                var fontFamily = 'Helvetica Neue'; // Label font family
                ctx.font = fontStyle + ' ' + fontSize + 'px ' + fontFamily;
                var label = data; // Label text
                ctx.fillText(label, position.x, position.y);
              }
            });
          }
        });
      }
    });

    var ctx = document.getElementById('myPieChart').getContext('2d');
    var myPieChart = new Chart(ctx, {
      type: 'pie',
      data: {
        labels: ['Mathematics', 'Physics', 'Chemistry', 'History', 'Biology'],
        datasets: [{
          data: ['math', 'physics', 'chemistry', 'history', 'Biology'],
          backgroundColor: [
            'red',
            'blue',
            'yellow',
            'green',
            'purple'
          ]
        }]
      },
      options: {
        responsive: true,
        legend: {
          position: 'top',
        },
        title: {
          display: true,
          text: 'Pie Chart with Data Labels'
        },
        plugins: {
          datalabels: {
            color: 'white', // Label color
            font: {
              weight: 'bold' // Label font weight
            },
            formatter: function(value, context) {
              return value.toUpperCase(); // Custom label formatting function
            }
          }
        }
      }
    });
  </script>
</body>
</html>
Output:
Thanks read this article ,like and share this ariticle
If you solve Easyalgo DSA sheet then you can get a chance to get a prize of Rs. 2 lakhs, you have to solve only 350 questions.!
If you solve Easyalgo DSA sheet then you can get a chance to get a prize of Rs. 2 lakhs, you have to solve only 350 questions.!
Copyright © EasyAlgo All Rights Reserved
Comments
Add Comment